Assignment 4: Infographics and Posters
Instructional Design
My lesson strategy stemmed from Gagne’s Model of Instructional Design and his nine steps. Each is defined below.
1. Gaining attention: Students will enter the classroom to find a photo of a deer (different picture per child) and a dictionary (not everyone will have the same dictionary) on their desks. The instructions for this first five minute exercise will be: “Look up the animal that matches the photo on your desk in the dictionary and, after reading the first entry you went to, write one word on the back of the image from the definition that is used to describe the animal.”
2. Informing the Learner of the Objectives: After this quick exercise, students will be shown the infographic created above as an overview of the components of a dictionary. They will know from this overview that the objective of the lesson is to be able to use a dictionary to find a word, its spelling, part of speech, and pronunciation. They will also be led to compare their findings in the print dictionary to those in an online dictionary.
3. Stimulating recall of prior learning: Students will draw on their prior experience with younger children’s dictionaries to better understand a dictionary with more complexity.
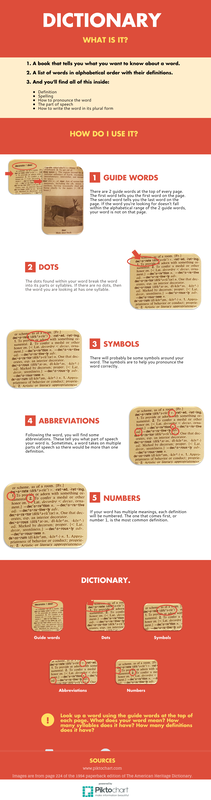
4. Presenting the stimulus: The infographic presented to students outlines the uses of a dictionary and how you use various “ingredients” of a dictionary: guide words, dots, symbols, abbreviations and numbers.
5. Providing learning guidance: The lesson involves using a dictionary to find examples of each element of the dictionary defined in the infographic. Students will be given a choice of applications or poster on which to create their product. When working in their small groups, students will learn from each other and present the best possible ideas for each required element.
6. Eliciting performance: Students create a product they will share with the class.
7. Providing feedback: I will provide verbal feedback while the students are working leading them to the best possible product.
8. Assessing performance: Students will rate their own product and presentation on a rubric.
9. Enhancing retention and transfer: Students will work in small groups to decide on the “best” examples of each element within their group, compare their information found in the print dictionary to that in a digital version, and create a digital poster of the information.
Using an Infographic to Teach
Students will refer to my infographic as the tool they reference to build their project. All of the information they need to remember the elements we’ve studied are on the infographic. From using this artifact as a resource, students will see firsthand the practical use of an infographic: an effective method of organizing, prioritizing and highlighting information. Rossow (n.d.) suggests infographics can be an important tool for introducing new information, the purpose of the dictionary infographic in my lesson. McCartney (2013) says “a good graphic makes information easily accessible, as it feeds into many students’ natural tendency to learn by seeing and interacting.” The author goes on to suggest methods of choosing the best infographic to use in lessons to maximize student learning. In this case, creating my own customized infographic with the exact elements I wish to highlight will provide students with the best learning experience.
Elements of Multimedia Principles
In order to increase visual clarity for students, I honored the design elements of Space, Shape, and Color (Hagen & Golombisky, 2013). In addition, Clark and Mayer’s (2011) multimedia design principle Thinking Skills 2 suggests that whole-task instruction presented through guided discovery. The infographic I created for my student’s use compartmentalizes the sub-topics so that third graders are not overwhelmed by the whole topic at once.
Discussion on Infographics and Posters
In general, an infographic takes a larger topic and, through the use of visual design elements, breaks it down into more consumable bites. While a poster may seek to do the same thing, its definition is broader since a poster could just be an image with one word on it. Therefore, whether digital or print, I consider an infographic to be a subset or type of poster. So if a poster is the display of information through images and text, an infographic is a poster that uses design elements such as shapes, space, and line to highlight or summarize a topic in an effort to make it more readily comprehensible to the user.
Student-Developed Infographics
An assignment such as this one, where students rely on an infographic as an information resource, is an excellent primer for subsequent lessons requiring students to create their own infographic. The skills needed to create an infographic are critical to student success: identifying the main idea, supporting information, important statistics, and sequencing events. Having students create infographics over a unit of study would advance them toward mastery of the content.
For this group of third grade students who have used an infographic about dictionaries, a follow-up lesson might be to create an infographic to be used by first graders in deciding what animal they want to study in an upcoming animal kingdom project. Beyond their own study of animals, as suggested by TeachingChannel.org (n.d.), creating products for other students validates and gives credibility to student work, further engaging them in the assignment. In groups of two or three, third graders would choose their topic from a list of animals ensuring that a wide variety are represented. Third grade students would then use the library to find print and digital information about their animal. They would be required to represent information such as habitat, diet, life span, and fun facts. In addition, they would obtain and cite images from reputable sources such as Pixabay.com, Photosforclass.com, or those with an appropriate Creative Commons license. Citations in third grade would not take on a full format. They would just be required to include important information much like I did for "Sources" in the infographic above. Upon completion, this catalog of animal infographics would be available to first grade students to guide them in choosing an animal to study.
Challenges in This Assignment
I found this assignment to be valuable since it is directly applicable to my role as media specialist and technology integrationist. While I have gone to Canva.com several times to create posters and infographics, I have never used Piktochart. After a few fumbles and a little time searching for answers in tutorials, I was able to learn enough about Piktochart to create a custom infographic. My most significant challenge for this assignment was the time required to do it.
References
American Association of School Librarians. (2009). Standards for the 21st century learner. Retrieved from http://www.ala.org/aasl/standards/learning
Clark, R. C., & Mayer, R. E. (2011). E-learning and the science of instruction: Proven guidelines for consumers and designers of multimedia learning. San Francisco, CA: Pfeiffer.
Hagen, R. & Golombisky, K. (2013). White space is not your enemy: A beginner's guide to communicating visually through graphic, web & multimedia design. 2nd edition, Boston, MA: Focal Press.
National Governors Association Center for Best Practices. (2010). Common core state standards initiative: English - Language Arts. Retrieved from http://www.corestandards.org/ELA-Literacy/
Rossow, P. (n.d.). A primer on infographics in the classroom. Retrieved from http://www.teachthought.com/literacy/a-primer-on-infographics-in-the-classroom/
TeachingChannel.org. (n.d.). Share strategies with posters. Retrieved from https://www.teachingchannel.org/videos/classroom-posters-educate
My lesson strategy stemmed from Gagne’s Model of Instructional Design and his nine steps. Each is defined below.
1. Gaining attention: Students will enter the classroom to find a photo of a deer (different picture per child) and a dictionary (not everyone will have the same dictionary) on their desks. The instructions for this first five minute exercise will be: “Look up the animal that matches the photo on your desk in the dictionary and, after reading the first entry you went to, write one word on the back of the image from the definition that is used to describe the animal.”
2. Informing the Learner of the Objectives: After this quick exercise, students will be shown the infographic created above as an overview of the components of a dictionary. They will know from this overview that the objective of the lesson is to be able to use a dictionary to find a word, its spelling, part of speech, and pronunciation. They will also be led to compare their findings in the print dictionary to those in an online dictionary.
3. Stimulating recall of prior learning: Students will draw on their prior experience with younger children’s dictionaries to better understand a dictionary with more complexity.
4. Presenting the stimulus: The infographic presented to students outlines the uses of a dictionary and how you use various “ingredients” of a dictionary: guide words, dots, symbols, abbreviations and numbers.
5. Providing learning guidance: The lesson involves using a dictionary to find examples of each element of the dictionary defined in the infographic. Students will be given a choice of applications or poster on which to create their product. When working in their small groups, students will learn from each other and present the best possible ideas for each required element.
6. Eliciting performance: Students create a product they will share with the class.
7. Providing feedback: I will provide verbal feedback while the students are working leading them to the best possible product.
8. Assessing performance: Students will rate their own product and presentation on a rubric.
9. Enhancing retention and transfer: Students will work in small groups to decide on the “best” examples of each element within their group, compare their information found in the print dictionary to that in a digital version, and create a digital poster of the information.
Using an Infographic to Teach
Students will refer to my infographic as the tool they reference to build their project. All of the information they need to remember the elements we’ve studied are on the infographic. From using this artifact as a resource, students will see firsthand the practical use of an infographic: an effective method of organizing, prioritizing and highlighting information. Rossow (n.d.) suggests infographics can be an important tool for introducing new information, the purpose of the dictionary infographic in my lesson. McCartney (2013) says “a good graphic makes information easily accessible, as it feeds into many students’ natural tendency to learn by seeing and interacting.” The author goes on to suggest methods of choosing the best infographic to use in lessons to maximize student learning. In this case, creating my own customized infographic with the exact elements I wish to highlight will provide students with the best learning experience.
Elements of Multimedia Principles
In order to increase visual clarity for students, I honored the design elements of Space, Shape, and Color (Hagen & Golombisky, 2013). In addition, Clark and Mayer’s (2011) multimedia design principle Thinking Skills 2 suggests that whole-task instruction presented through guided discovery. The infographic I created for my student’s use compartmentalizes the sub-topics so that third graders are not overwhelmed by the whole topic at once.
Discussion on Infographics and Posters
In general, an infographic takes a larger topic and, through the use of visual design elements, breaks it down into more consumable bites. While a poster may seek to do the same thing, its definition is broader since a poster could just be an image with one word on it. Therefore, whether digital or print, I consider an infographic to be a subset or type of poster. So if a poster is the display of information through images and text, an infographic is a poster that uses design elements such as shapes, space, and line to highlight or summarize a topic in an effort to make it more readily comprehensible to the user.
Student-Developed Infographics
An assignment such as this one, where students rely on an infographic as an information resource, is an excellent primer for subsequent lessons requiring students to create their own infographic. The skills needed to create an infographic are critical to student success: identifying the main idea, supporting information, important statistics, and sequencing events. Having students create infographics over a unit of study would advance them toward mastery of the content.
For this group of third grade students who have used an infographic about dictionaries, a follow-up lesson might be to create an infographic to be used by first graders in deciding what animal they want to study in an upcoming animal kingdom project. Beyond their own study of animals, as suggested by TeachingChannel.org (n.d.), creating products for other students validates and gives credibility to student work, further engaging them in the assignment. In groups of two or three, third graders would choose their topic from a list of animals ensuring that a wide variety are represented. Third grade students would then use the library to find print and digital information about their animal. They would be required to represent information such as habitat, diet, life span, and fun facts. In addition, they would obtain and cite images from reputable sources such as Pixabay.com, Photosforclass.com, or those with an appropriate Creative Commons license. Citations in third grade would not take on a full format. They would just be required to include important information much like I did for "Sources" in the infographic above. Upon completion, this catalog of animal infographics would be available to first grade students to guide them in choosing an animal to study.
Challenges in This Assignment
I found this assignment to be valuable since it is directly applicable to my role as media specialist and technology integrationist. While I have gone to Canva.com several times to create posters and infographics, I have never used Piktochart. After a few fumbles and a little time searching for answers in tutorials, I was able to learn enough about Piktochart to create a custom infographic. My most significant challenge for this assignment was the time required to do it.
References
American Association of School Librarians. (2009). Standards for the 21st century learner. Retrieved from http://www.ala.org/aasl/standards/learning
Clark, R. C., & Mayer, R. E. (2011). E-learning and the science of instruction: Proven guidelines for consumers and designers of multimedia learning. San Francisco, CA: Pfeiffer.
Hagen, R. & Golombisky, K. (2013). White space is not your enemy: A beginner's guide to communicating visually through graphic, web & multimedia design. 2nd edition, Boston, MA: Focal Press.
National Governors Association Center for Best Practices. (2010). Common core state standards initiative: English - Language Arts. Retrieved from http://www.corestandards.org/ELA-Literacy/
Rossow, P. (n.d.). A primer on infographics in the classroom. Retrieved from http://www.teachthought.com/literacy/a-primer-on-infographics-in-the-classroom/
TeachingChannel.org. (n.d.). Share strategies with posters. Retrieved from https://www.teachingchannel.org/videos/classroom-posters-educate
